Investigation of the layer structure, identity and composition of an unknown coating system can be done in several ways.
Composition
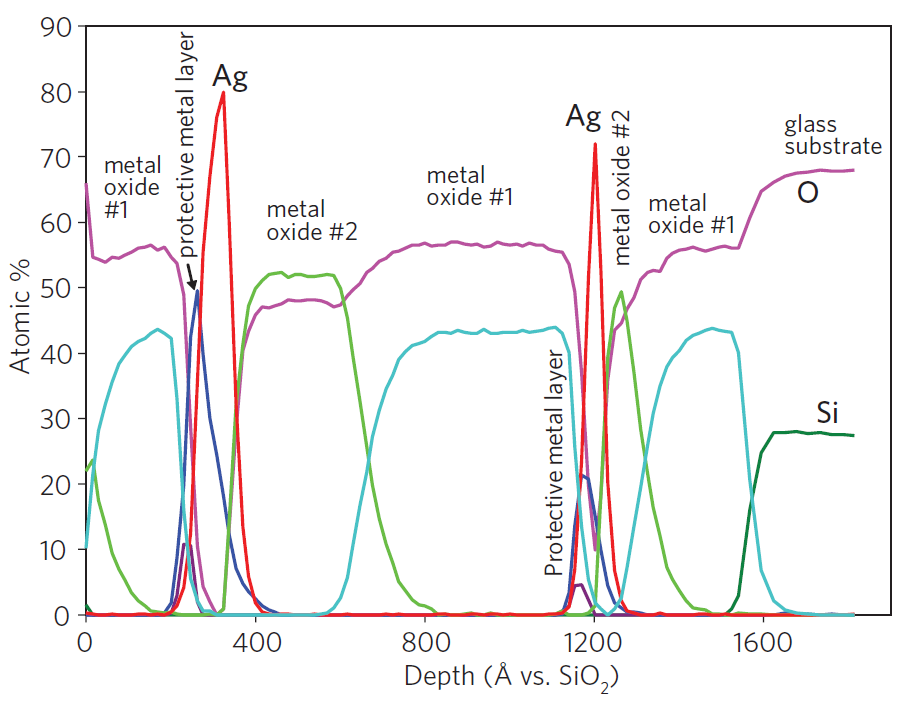
An unknown glass coating structure was profiled by X-ray Photoelectron Spectroscopy (XPS). All layers were identified and the composition of each layer was determined. Compositions are accurate. Layer thicknesses are approximate.
An unknown glass coating structure was profiled by X-ray Photoelectron Spectroscopy (XPS). All layers were identified and the composition of each layer was determined.
Compositions are accurate. Layer thicknesses are approximate.
Trace Level and Interdiffusion
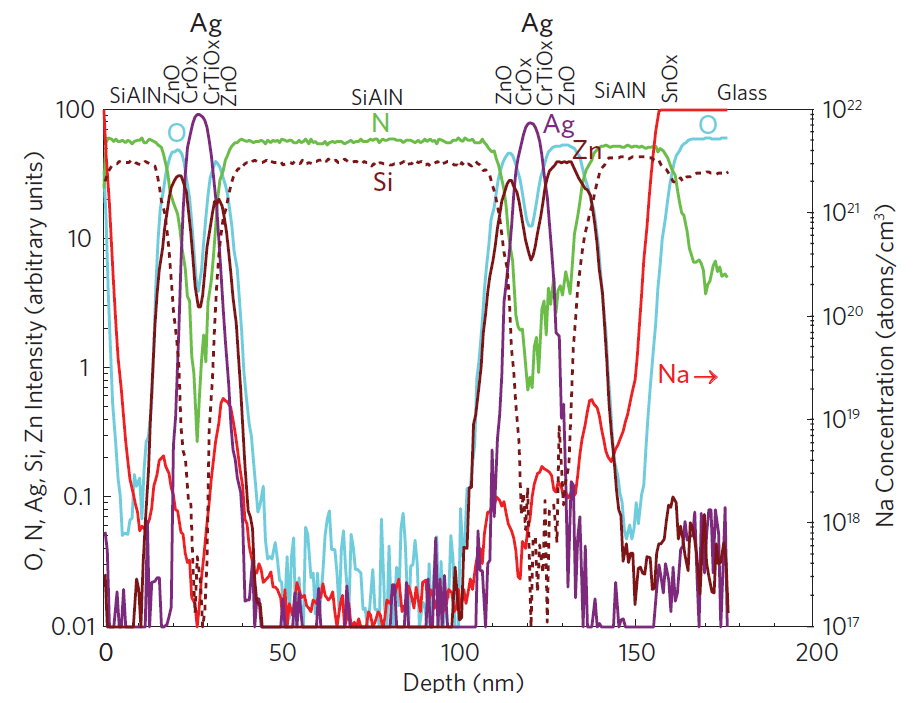
An unknown glass coating structure was depth profiled by SIMS. We can observe the major element profiles along with the trace element profiles including Na diffusion from the substrate glass. Composition can be accurately determined with standards. Trace element concentrations are accurate. Layer thicknesses are approximate, in the absence of correlation to other measurements.
Effect of glass tempering
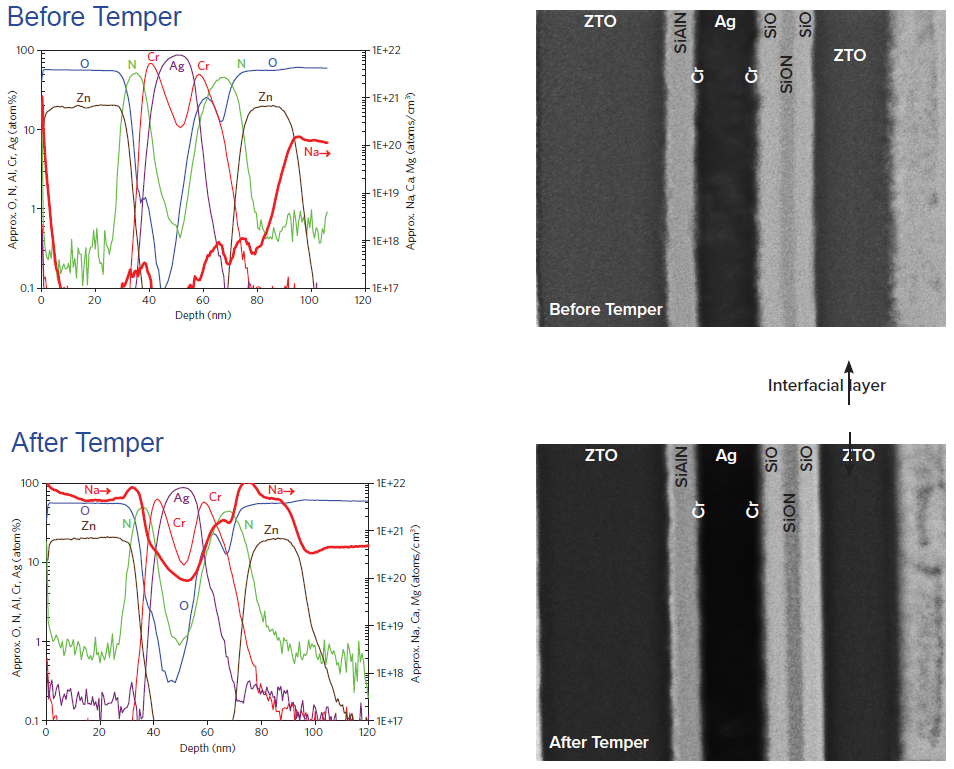
Annealing and tempering of glass will change the glass and coating microstructure and cause interdiffusion between layers. SIMS depth profiling shows diffusion of major and minor elements between layers. TEM shows changes in microstructure.
SIMS shows major diffusion of Na after tempering, from the glass substrate through all of the coating layers and to the surface. Si and N have diffused from the SiAlN layers into the adjoining layers.
TEM shows no change in coating layer thicknesses after tempering. However, the interfaces between layers have become more defined and one interfacial layer has disappeared.
Transparent conductive oxide (TCO) analysis
Many glass coating systems include a TCO (transparent conductive oxide) layer to make electrical contact with the layer structure. For solar applications, TCO layers need to be optically transparent with a bandgap that minimizes light trapping yet still has high electrical conductivity.
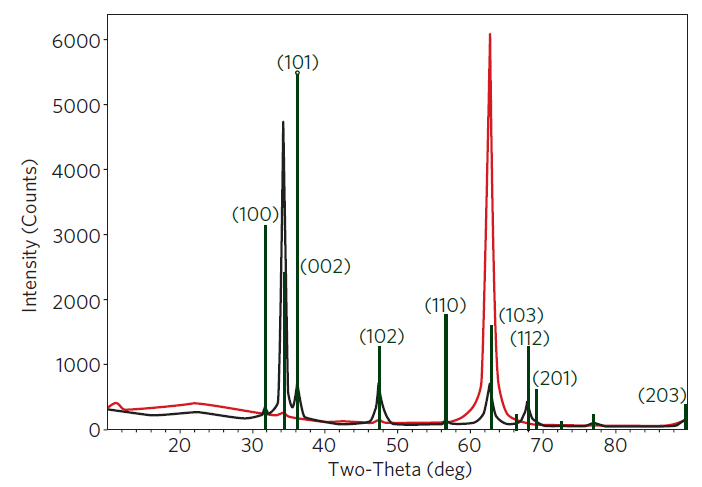
Grain Orientation
TCO conductivity can be affected by dopants, contaminants, grain size, and grain orientation. GIXRD (Glancing Incidence X-Ray Diffraction) compares 2 TCOs: the red curve is from a low conductivity film while the black is from a higher conductivity film. The textures are quite different.
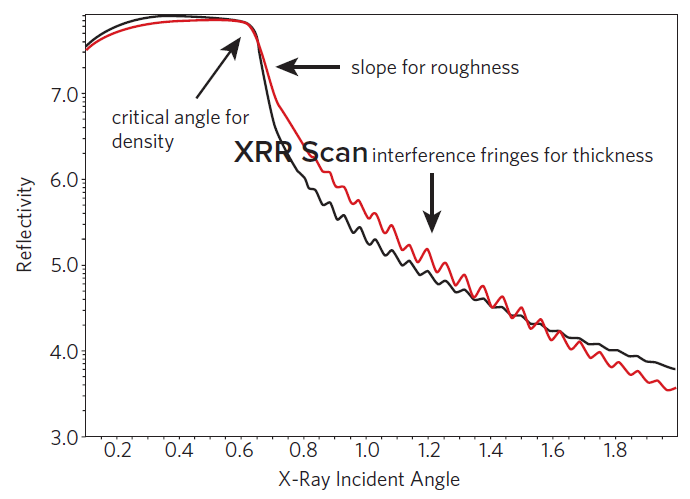
Thickness/density/roughness
TCO thickness, roughness and density can be measured quantitatively without the need for standards using XRR (X-Ray Reflectivity). Critical angle reveals density, the slope after the critical angle reveals roughness, and interference fringes reveals thickness. Comparison of two coatings shows similar thickness and density, but different surface and interface roughness.
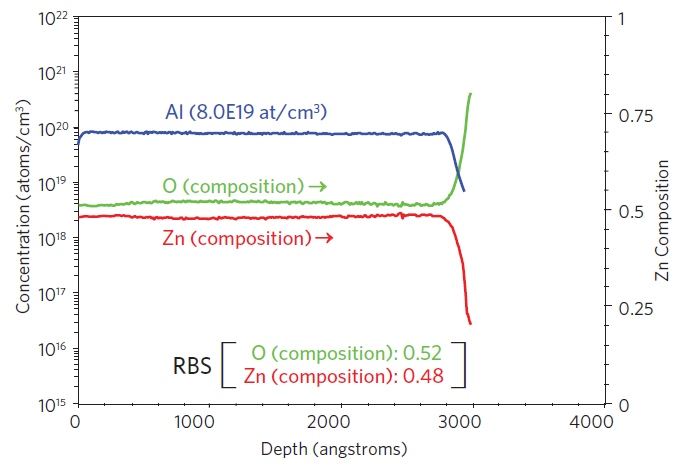
Composition
Dopants can increase the electrical conductivity of TCOs but dopants can also reduce optical transmission. SIMS depth profiling reveals dopant concentration. The Zn:O ratio was calibrated by RBS (Rutherford Backscattering Spectrometry).
Would you like to learn more about Coatings on glass?
Contact us today for your coatings on glass needs. Please complete the form below to have an EAG expert contact you.
To enable certain features and improve your experience with us, this site stores cookies on your computer.
Please click Continue to provide your authorization and permanently remove this message.