Stainless Steel Corrosion: Medical Device Applications with Auger
Home » Stainless Steel Corrosion: Medical Device Applications with Auger
Stainless steel is used extensively in the biomedical industry including catheters, stents, screws, tubing, guidewires, dental products, orthopedics and a wide variety of medical instruments.
Stainless steel is often the metal of choice because of its resistance to corrosion. However, corrosion can still occur depending on factors such as the grade of stainless, the quality of the passivation layer, the contaminants present on the surface, and the environment the stainless is exposed to.
Auger Electron Spectroscopy (AES) can be effective in determining the quality of passivation layers used to prevent corrosion. In addition, if corrosion does occur, Auger analysis can be instrumental in determining its cause. Auger analysis is capable of detecting very localized corrosion and potential causes, as shown in the following case study.
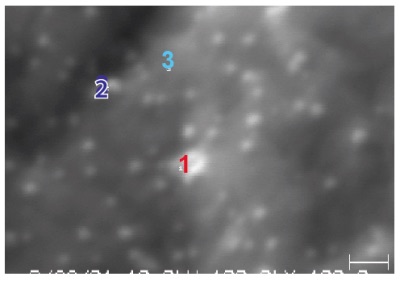
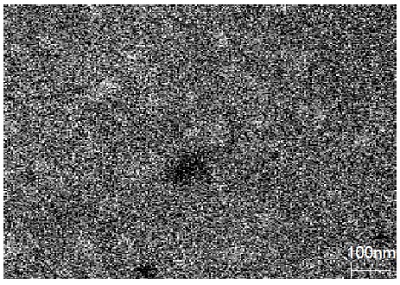
Figure 1 shows a high magnification secondary electron image (100,000x magnification) obtained from an Auger instrument on the as-received surface of a piece of 300 series stainless steel sheet. The micrograph shows a series of extremely small defects, most of which being only about 25nm in diameter. This SEM image was used to define points on which Auger electron spectroscopy was to be performed. One large and one small particle (points 1 and 2, respectively) were analyzed along with a control region (point 3) off of the defects.
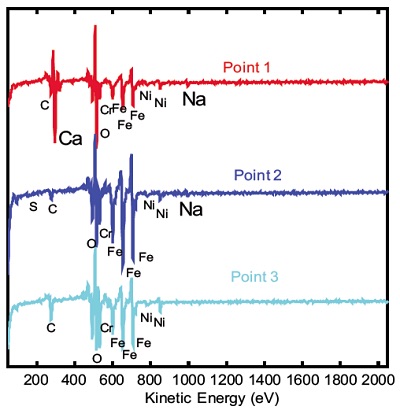
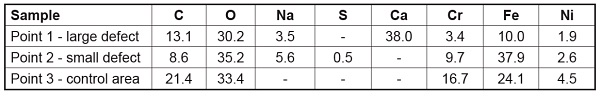
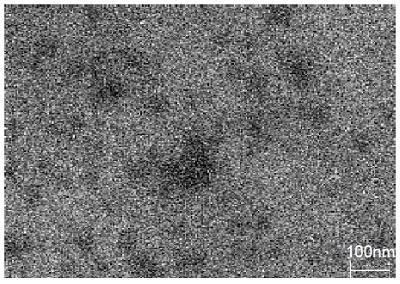
All three of the survey spectra show the presence of the expected C, O, Cr, Fe and Ni from the air-exposed stainless steel surface. In addition, the spectrum from point 1 (larger defect) shows the presence of a large amount of Ca along with a smaller Na peak. The Auger spectrum from the small defect (point 2) shows the presence of S and Na contaminants but also shows much different Fe to Cr peak ratios than the spectrum from the control area (point 3). Quantification of the elements detected from these three points is shown in Table 1. Auger maps were acquired for several of the elements of interest including Ca, Cr, and Fe. The map for Ca reveals a lateral distribution of Ca within a 1mm2 field of view.
Figure 3 Cr AES Map
Figure 4 Fe AES Map
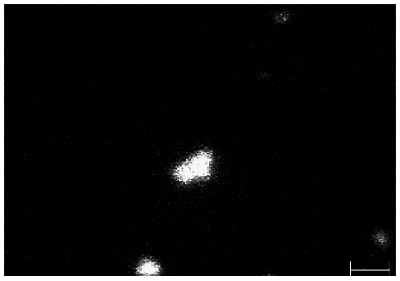
Figure 5 Ca AES Map
SUMMARY
Although scores of particle defects were observed in the SEM image, only a few of them appear to have significant Ca, as shown in the Ca Auger map. Most of the smaller particles correspond to larger concentrations of Fe, compared to the background area (Point 3). This indicates that localized corrosion has occurred within these 25nm-sized defects with an obvious potential cause being the presence of Na.
Would you like to learn more about Stainless Steel Corrosion?
Contact us today for your stainless steel corrosion needs. Please complete the form below to have an EAG expert contact you.
To enable certain features and improve your experience with us, this site stores cookies on your computer.
Please click Continue to provide your authorization and permanently remove this message.