Contact Lenses: Understanding Surface Chemistry Critical to Optimizing Design
Home » Contact Lenses: Understanding Surface Chemistry Critical to Optimizing Design
Contact lenses are complex materials that must provide a range of physical properties in order to be effective, safe and comfortable to wear. EAG Laboratories has extensive experience in the analysis and characterization of contact and intraocular lens products. Contact and intraocular lens products have critical surface chemistry characteristics to ensure comfort and performance. We have extensive experience in surface and polymer characterization to help contract and intraocular lens manufacturers.
These properties include: (1) high oxygen permeability in order to transmit O2 to the cornea, (2) hydrophilic surface so that a continuous tear film coats the lens providing lubrication and (3) resistance to bacterial and protein adsorption.
Understanding both the surface and bulk chemistry of lenses is critical to engineering optimal performance. The combination of surface sensitivity (0-5 nm sampling depth), standardless quantification and ability to detect not only elements but also functional groups make XPS (X-ray Photoelectron Spectroscopy) a powerful analytical tool for determining the near-surface chemistry of these materials.
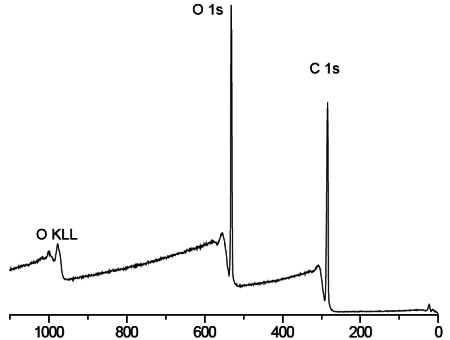
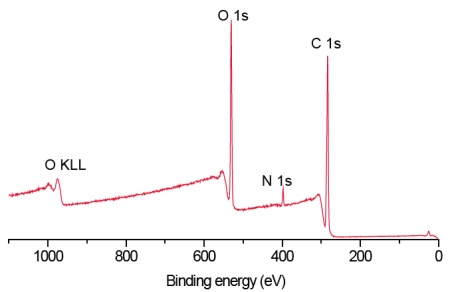
Survey scans below show a common hydrogel lens material (poly hydroxyethylmethacrylate (HEMA) without (Figure 1) and with (Figure 2) the incorporation of a hydrophilic polyvinylpyrrolidone (PVP) co-polymer. It is clear that XPS can detect PVP based on the nitrogen in the PVP-containing lens.


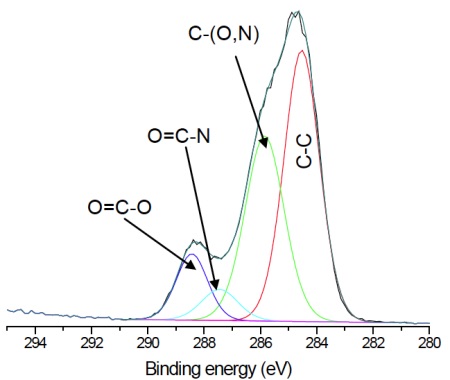
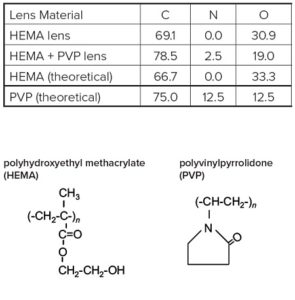
For the pure HEMA lens there is excellent agreement between the observed and expected elemental concentrations and the carbon 1s spectrum (Figure 3) indicates a pure, uncontaminated lens surface. PVP is added to the second lens to improve the tear wettability of the lens surface and so it is important to be able to quantify the fraction of PVP at the surface. This is done by comparing the observed nitrogen concentration with that expected for pure PVP. Lens 2 contained 20% PVP at the surface. This result is confirmed by the presence of a O=C-N peak in the carbon 1s spectrum (Figure 4).
![Figure 3 Curve fit of high resolution carbon 1s spectrum from pHEMA lens. Note the 2:1 ratio of C-O : COO consistent with known HEMA chemical structure. Expected concentrations are [C]=66.7% and [O]=33.3%, in excellent agreement with Table 1.](https://www.eag.com/wp-content/uploads/2017/01/application-note-contact-lenses-understanding-surface-chemistry-critical-to-optimizing-design-M-004816_Figure_3.jpg)

Typical services for Contact & Intraocular Lens Testing include:
- Microscopy to study morphology and structure
- Surface analysis to evaluate surface chemistry
- Depth profiling to understand surface chemistry thickness
- Contaminant identification
Would you like to learn more about Surface Chemistry of Contact Lenses?
Contact us today for your surface chemistry of contact lens needs. Please complete the form below to have an EAG expert contact you.
