Thermal Analysis Techniques
Home » Thermal Analysis Techniques
The scientists at EAG are experts in using thermal analysis techniques for materials characterization as well as for designing custom studies. This application note details TGA (Thermogravimetric Analysis), TG-EGA (Thermogravimetric Analysis with Evolved Gas Analysis), DSC (Differential Scanning Calorimetry), TMA (Thermomechanical Analysis) and DMA (Dynamic Mechanical Analysis).
These techniques have played key roles in detailed materials identifications, failure analysis and deformulation (reverse engineering) investigations.
THERMOGRAVIMETRIC ANALYSIS (TGA)
TGA measures changes in sample weight in a controlled thermal environment as a function of temperature or time. The changes in sample weight (mass) can be a result of alterations in chemical or physical properties.
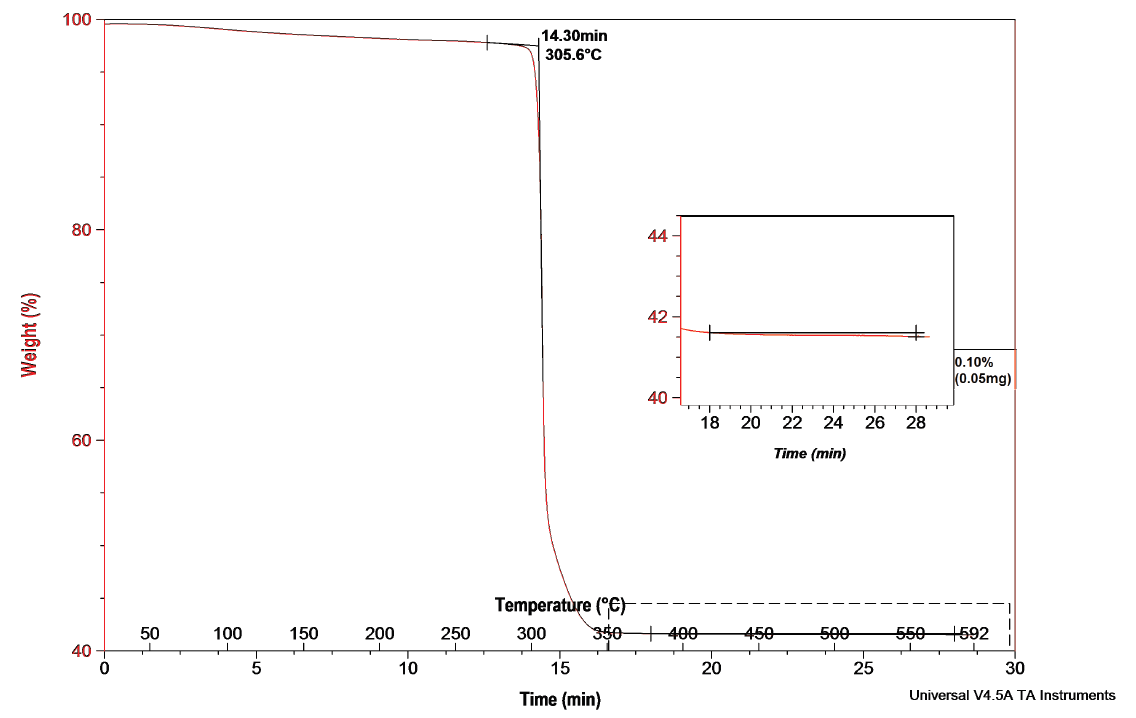
TGA is useful for investigating the thermal stability of solids and liquids. A sensitive microbalance measures the change in mass of the sample as it is heated or held isothermally in a furnace. The purge gas surrounding the sample can be either chemically inert or reactive. TGA instruments can be programmed to switch gases during the test to provide a wide range of information in a single experiment.
COMMON APPLICATIONS
- Thermal stability/degradation studies
- Investigating mass losses resulting from physical and chemical changes
- Quantitation of volatiles/moisture
- Screening additives
- V aporization, sublimation
- Deformulation/failure analysis
- Loss on drying
- Residue/filler content
- Decomposition kinetics
STRENGTHS
- Small sample size
- Analysis of solids and liquids with minimal sample preparation
- Quantitative analysis of multiple mass loss thermal events from physical and chemical changes of materials
- Separation and analysis of multiple overlapping mass loss events
LIMITATION
- Evolved products are identified only when the TGA is connected to an evolved gas analyzer (e.g. TGA/MS or TGA/FTIR)
THERMOGRAVIMETRIC ANALYSIS WITH EVOLVED GAS ANALYSIS (TG-EGA)
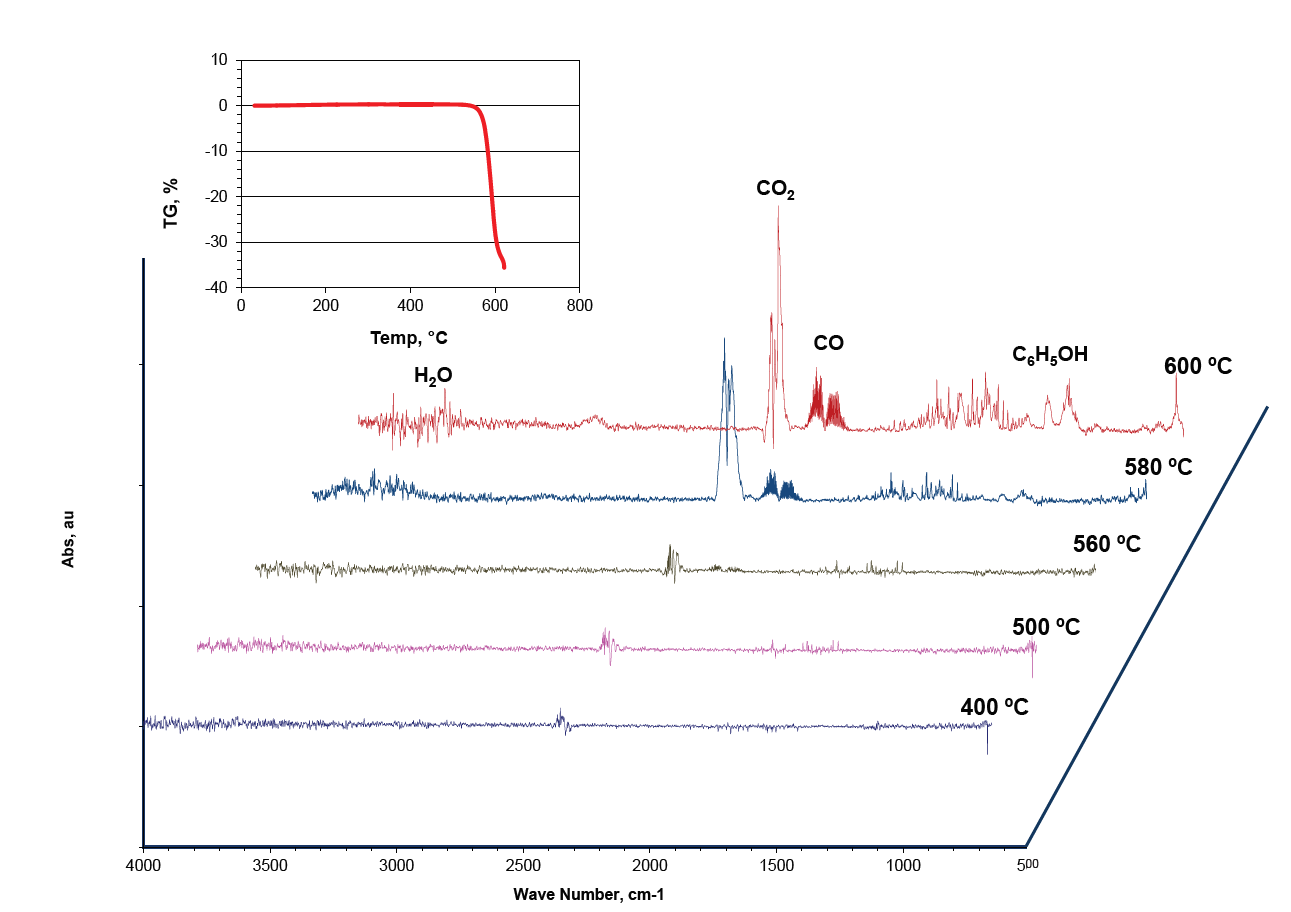
Evolved Gas Analysis Outgassing and decomposition of a material is analyzed by TGA-IR. The insert is the TGA profile. The FTIR spectra of evolved gas species from 400°C – 600°C were collected. Intense evolution of CO, H2O, CO2 and C6H5OH can be seen above 580°C.
DESCRIPTION
TG-EGA instrumentation is used to study the physical and chemical processes that result in mass loss or gain. Like standard TGA, the sample is heated in a controlled gas atmosphere using a programmed temperature sweep or isothermal hold. But TG-EGA goes one step further: a gas analyzer is coupled to the TGA furnace using a heated transfer line, which enables analysis of the gases evolved by the sample during heating and pyrolysis. The evolved gas analyzer is used to identify the chemistries present in the off-gassing and pyrolyzed components.
Evolved Gas Analyzer options for TG-EGA include:
- Fourier Transform Infrared Spectrophotometer (FTIR) – identification of chemical family, and, in some cases, specific compound
- Mass Analyzer – chemical residuals are specifically assigned, but sometimes have other possible answers
COMMON APPLICATIONS
- Thermal stability (degradation) studies
- Monitoring mass changes under controlled gas atmosphere and temperature with identification of off-gassing and pyrolysis products
- Analyzing trace volatiles, dehydration, additives, chemical reactions, formulation components, mechanism of decomposition
- Analysis of polymers, organic and inorganic materials
STRENGTHS
- Simultaneous thermogravimetric analysis (TGA) and characterization of evolved chemical residuals
- Small sample size
- Analysis of solids and liquids with minimal sample preparation
- Detection of multiple mass loss thermal events from physical and chemical changes of materials
LIMITATIONS
- TGA-FTIR does not detect non-polar molecules, such as H2, N2, O2
- TGA-FTIR spectral identification of product gases may be limited to chemical family or class
- Secondary gas-phase reactions can complicate identification of product gases
DIFFERENTIAL SCANNING CALORIMETRY (DSC)
DESCRIPTION
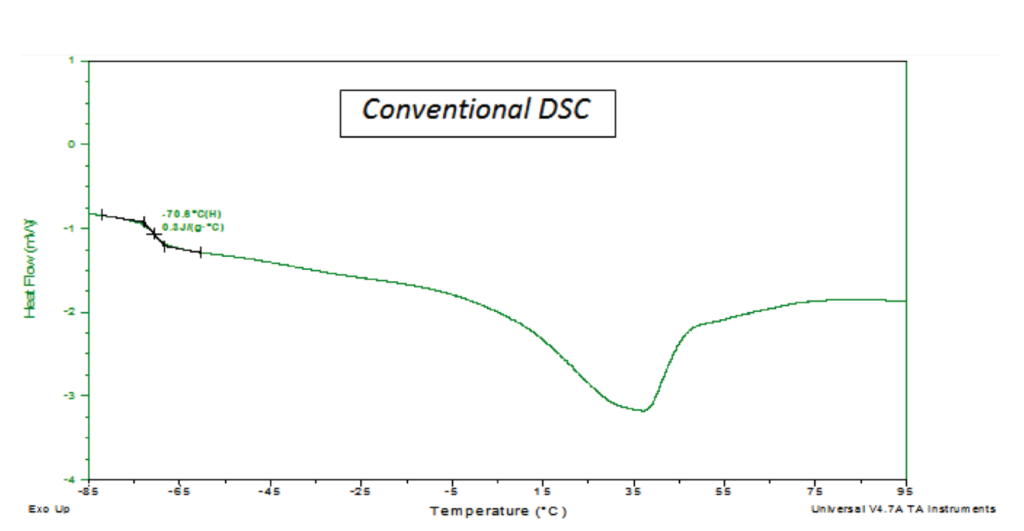
DSC performs quantitative calorimetric measurements on solid, liquid or semisolid samples. Heat flux DSC measures the difference in temperature (T) between the sample and an inert reference and calculates the quantity of heat flow (q) into or out of the sample using the equation q = DT/R, where R is the thermal resistance of the transducer (DSC cell).
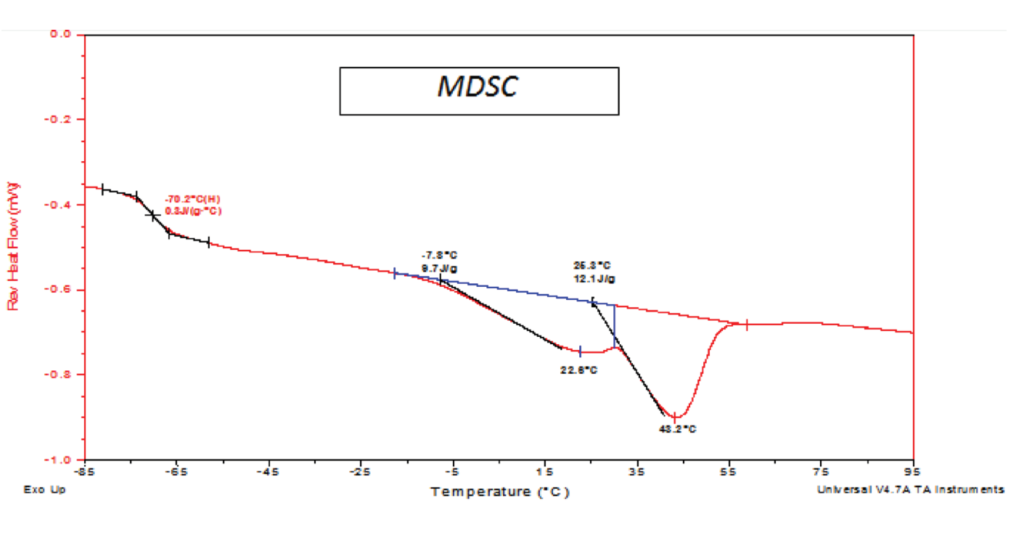
DSC Q SeriesTM models (TA Instruments, Inc.) measure absolute heat flow by application of cell resistance and capacitance calibrations. This feature enables the direct measurement of specific heat capacity of a material using a single experiment. The Q SeriesTM feature a special operating mode called temperature modulated DSC (MDSC). MDSC applies a sinusoidal temperature modulation superimposed over a linear heating rate. MDSC is a powerful technique which makes it possible to measure weak transitions, separate overlapping thermal events and provide highly accurate heat capacity measurements.
COMMON APPLICATIONS
- Analyze phase transitions and reactions: melting point, crystallization, glass transition, cure temperature, delta H
- Measure the heat capacity of pure compounds and mixtures
- Compare quality (QC, failure analysis, new material evaluation)
- Identify unknown materials
- Evaluate formulations, blends and effects of additives
- Determine the effects of aging and evaluate thermal history
- Estimate percent crystallinity
- Determine percent purity of relatively pure organics
- Study cure or crystallization kinetics and effect of impurities on crystallization
- Determine phase separation of polymer blends and copolymers
- Estimate degree of cure; measure residual cure
- Evaluate eutectic point
- Characterize polymorphic materials
- Resolve subtle, weak or overlapping phase transitions
STRENGTHS
- Small sample size
- Highly accurate measurement of phase transitions and heat capacities
- Very precise temperature control (isothermal holds and heating/cooling ramps)
- Programmable sequences
- Sensitive measurement of subtle or weak phase transitions
- Ability to separate overlapping thermal transitions
LIMITATIONS
- Works best for samples having a surface that spreads relatively flat against the bottom of the “crucible” or pan.
- Accurate data cannot be obtained when decomposition occurs within the same temperature region as the phase transition (e.g. melting)
- Mass of sample has to remain constant in the pan for accurate measurement; that means no loss of sample to evaporation or sublimation during the test
DYNAMIC MECHANICAL ANALYSIS (DMA)
DESCRIPTION
Polymers respond to the energy of motion in two ways: (1) elastic response which is important for shape recovery and (2) viscous response which is essential for dispersing mechanical energy and preventing breakage. Dynamic mechanical analysis (DMA) is used to study these responses, called viscoelastic properties, under conditions of low applied mechanical force.
Polymer viscoelasticity is dependent on temperature and time. Controlled heating and/or cooling are incorporated in DMA instruments to study temperature effects on polymer stiffness and resiliency. The test speed or time scale used for mechanically deforming the polymer enables study of time (or frequency) effects on resistance to permanent deformation. Knowledge obtained through strategic use of the parameters of force, temperature, time or frequency provides the basis for predicting polymer performance in real world applications.
DMA utilizes a system of clamps for mechanical testing of solid polymeric materials. The polymer test sample must first be trimmed, cut or molded into a shape that will work with the selected clamp type. Clamp selections for polymer samples are based on giving the most suitable type of mechanical motion for the specific study type:
- Tension (stretch)
- Compression (push)
- Flexure (bend)
- Shear (motion parallel to the sample surface)
All DMA clamp configurations feature a movable clamp and one or more stationary clamps, which are used to mount the sample. The movable part applies force and displaces the sample by stretching, bending, shearing or compressing it. Some clamp types must apply an initial low force to the sample prior to setting the clamp in motion. This keeps the sample taut (tension) or maintains contact between the movable clamp and sample (compression, 3-point bend) throughout a dynamic test.
In dynamic testing, a sinusoidal motion is applied to the sample by the movable clamp. As the cyclic displacement of the material occurs at the specified force, the amplitude of the sine wave response is measured. The stress and strain responses of the material are calculated based on the geometry and dimensions of the sample and the phase angle between the sinusoidal input and response.
The stress and strain values of viscoelastic materials, including polymers, are a function of temperature, time, frequency, and the applied oscillation amplitude. However, for dynamic testing, the best practice is to keep the measurements independent of amplitude. Therefore, DMA method development incorporates an amplitude sweep to select amplitude parameters within the linear viscoelastic range (LVR) of the material. For most materials, the strain amplitudes of less than 1% are recommended to ensure operation within the LVR.
The phase angle measured by DMA is used to derive trigonometric equations for stress and strain. The mathematical derivation of these equations is beyond the scope of this paper. However, the relationship of stress and strain depends on the phase angle, or how much the polymer response lags behind the strain input. The trigonometric relationship of stress to strain incorporating the phase angle gives three quantities that describe how much the sample response is in-phase and out-of-phase with the mechanical input.
These are:
- E′ = Storage Modulus
- E″ = Loss Modulus
- E″/E′ = tan δ
When the sample is tested in shear mode, the storage and loss modulus are denoted as G′ and G″, respectively. And tan δ becomes G″/G′.
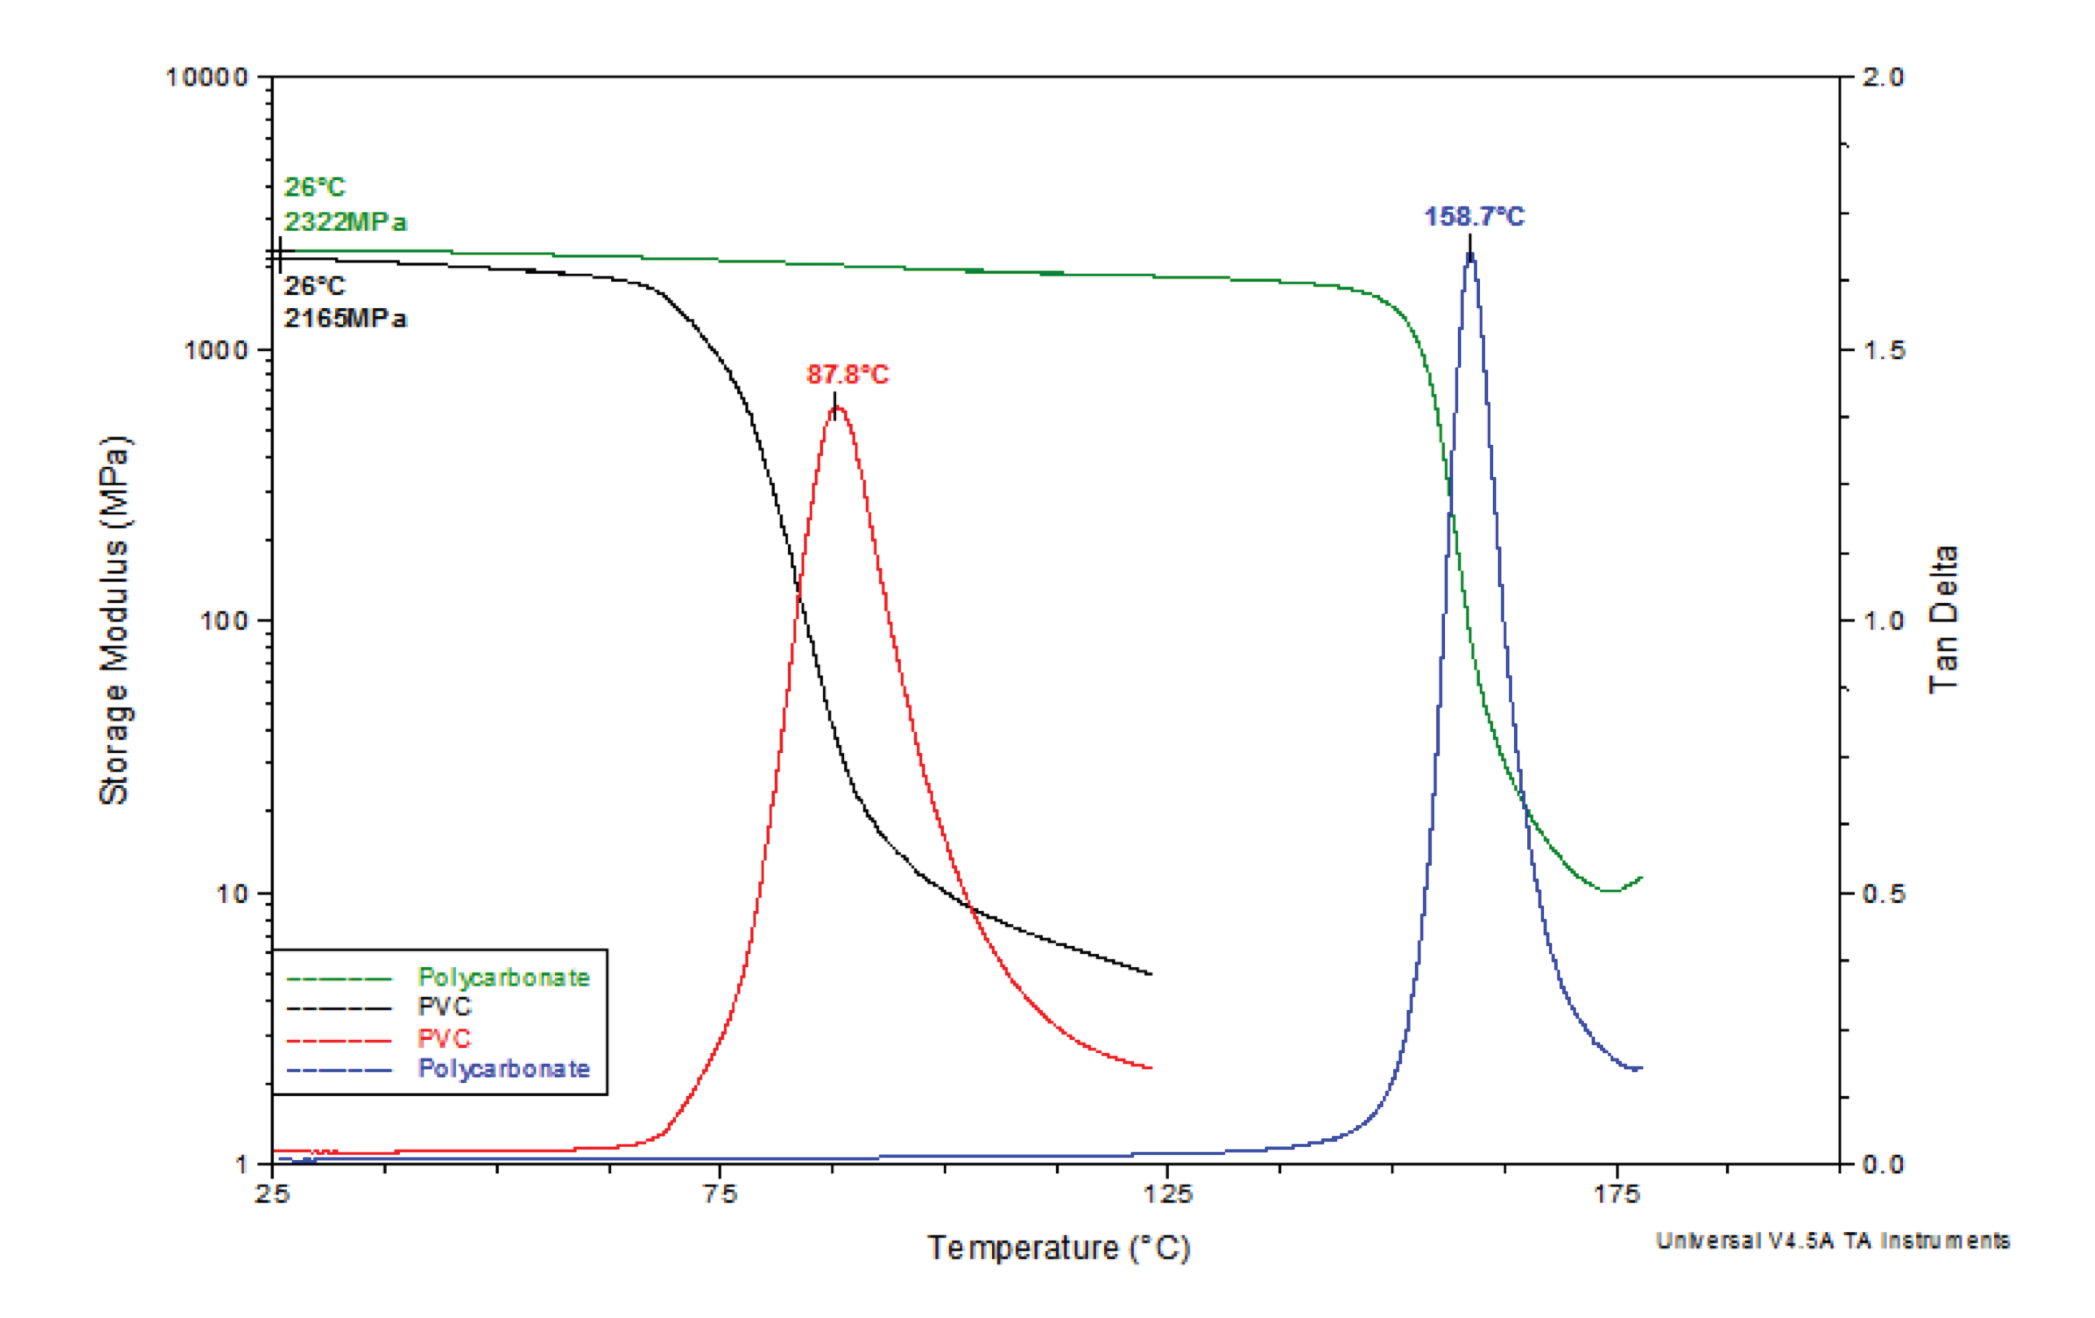
Storage modulus (E′ or G′) corresponds to the mechanical energy stored by the material during a loading cycle. Consequently, the storage modulus is related to the stiffness and shape recovery of the polymer during loading. The loss modulus (E″ or G″) represents the damping behavior, which indicates the polymer’s ability to disperse mechanical energy through internal molecular motions. By comparison, tan delta is the ratio E″/ E′. The peak maximum in tan delta best represents the glass transition (Tg) where the material exhibits long-range cooperative molecular motion which is consistent with rubbery flow, permanent deformation or both depending on molecular structure.
COMMON APPLICATIONS
- Study the “viscoelastic spectrum”, which shows temperature (and time) dependent modulus changes from hard/rigid to soft/rubbery
- Determine glass transition (Tg) of polymers
- Study changes in elastic (storage) modulus as a function of frequency
- Characterize “damping”: dissipation of mechanical energy through internal motion (loss modulus, tan delta)
- Comparative and failure analysis of polymers
- Study phase separation of polymer blends or copolymers
- Determine effects of physical aging, crosslinking or postcure on mechanical properties and Tg
- Time-Temperature Superpositioning (TTS): predict material behavior over a wider frequency (or longer time) range using a few strategic DMA tests
STRENGTHS
- Strain sweep: uses a range of strain amplitudes to find the region of linear viscoelastic performance at constant temperature
- Frequency sweep: uses various oscillation rates to determine effect of frequency on mechanical properties
- Temperature ramp or isothermal conditions: precision heating and cooling to study effect of temperature on mechanical response
- Various displacement modes: 1) Tensile (stretch) for thin films and fibers; 2) Flexural (bend) for filled and crystalline polymers, thermoplastics, crosslinked polymers, elastomers and composites; 3) Shear for soft foams, gels and rubbers
- Controlled force / displacement modes: non-oscillatory testing that measures mechanical response after applying instantaneous force or displacement: 1) Creep/recovery; 2) Stress relaxation
LIMITATIONS
- Geometrically uniform test specimens
- Specimens should be free of inclusions, bubbles and cracks
- Needs multiple specimens for method development and obtaining statistical averages of properties
Would you like to learn more about Thermal Analysis Techniques?
Contact us today for your thermal analysis needs. Please complete the form below to have an EAG expert contact you.