Glass Delamination in Pharmaceutical Vials Related to Surface Chemical Changes
Home » Glass Delamination in Pharmaceutical Vials Related to Surface Chemical Changes
There have been several high profile reports related to the appearance of glass lamellae in parenteral pharmaceutical solutions.1 The US Food and Drug Administration lists roughly a dozen drug recalls in recent years associated with glass delamination or unidentified particulates observed in solution. This problem has sparked an industry-wide effort to understand this phenomenon and develop procedures to assess the durability of glass containers. As a result of these recent problems the US Pharmacopeial Convention has issued a chapter describing methods to screen and evaluate the durability of glass containers.2
Recommended analytical methods include: Secondary Ion Mass Spectrometry (SIMS), Scanning Electron Microscopy (SEM), Inductively Coupled Plasma Mass Spectrometry (ICP-MS) and Optical Microscopy.
EAG Laboratories offers this complete suite of analytical testing for pharmaceutical containers. Additionally, we have found X-ray Photoelectron Spectroscopy (XPS, also known as Electron Spectroscopy for Chemical Analysis, ESCA) to be a valuable tool for examining the outer 5-10 nm of glass surfaces. Each of these techniques provides complementary information. Below is a brief summary of the information available from these different tools.
SIMS is a quantitative, trace elemental analysis technique generally used in a depth profiling mode. It is one of the only techniques capable of detecting hydrogen diffusion into glass.
XPS/ESCA is a quantitative technique that measures the composition of the extreme outer surface (5-10 nm) of a sample. Similarly to SIMS, XPS can also be used to depth profile samples. XPS can also be used to examine individual flakes larger than 30 µm recovered from solutions by filtration.
SEM provides high magnification images of glass surfaces to look for flaking, pitting or other anomalies associated with corrosion or surface degradation. The incorporation of EDS (Energy Dispersive X-ray Spectroscopy) with SEM permits semi-quantitative elemental analysis of individual flakes with percent level detection limits.
Optical Microscopy in differential interference contrast (DIC) mode provides enhanced contrast on glass, particularly of subtle surface features.
ICP-MS can measure trace levels (ppm-ppb) of elemental glass constituents (Na, B, Si, Al, Ca, etc.) in pharmaceutical solutions.
The appearance of visible glass flakes is the final step in a corrosion process that is rooted in the high temperature glass forming process. Our goal is to understand the chemical changes that lead to delamination so that glasses can be evaluated prior to a catastrophic failure. We begin by examining the surface chemistry of the glass before it has been exposed to any solution.
Surface Chemistry of As-Formed Containers
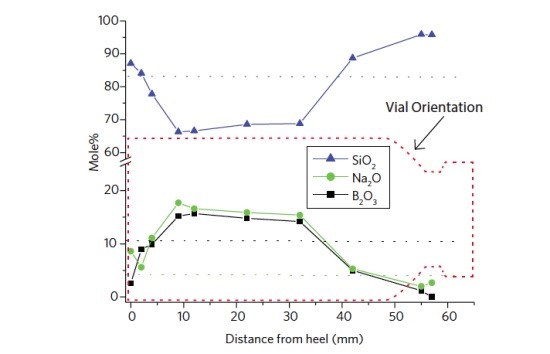
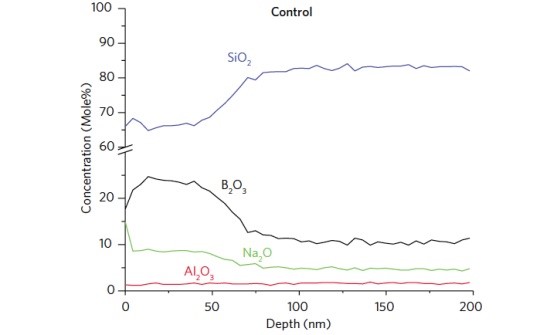
Figure 1 shows the surface composition of a Type I glass vial as a function of position along the vial length. For reference the bulk composition for each oxide is shown as a dotted line. The B2O3 and Na2O are depleted at the ends of the container and enriched along the sidewall. The cause of this compositional variation is likely due to volatization of Na and B species from the areas experiencing the highest temperatures during forming (bottom and shoulder) and condensation at areas not exposed to such temperature extremes. A depth profile acquired 10 mm from the heel (Figure 2) shows the B and Na enriched layer extends ~80 nm into the glass.
Figure 1 Measured surface (top 5 nm) composition along the length of an as formed vial. Note the B2O3 and Na2O depletion near the bottom and shoulder of the vial where high forming temperatures lead to volatilization. Horizontal dotted lines represent bulk glass composition.
Figure 2 Depth profile of an as formed glass vial showing B2O3 and Na2O enriched layers.
Surface Chemistry of Vials Exposed to Solutions
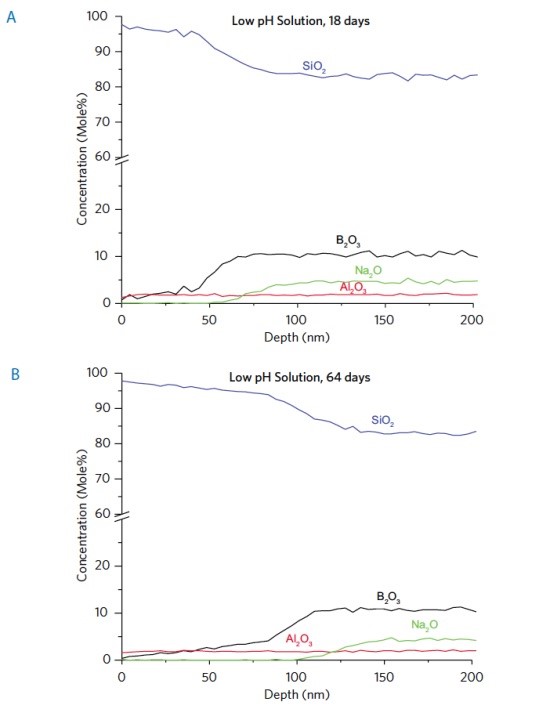
Glass corrosion mechanisms are different depending on the pH of the solution. Vials from the same lot of material were exposed to both low (acidic) and high (alkaline) pHs. Figures 3a and 3b show depth profiles of vials exposed to a low pH solution for varying times. An 80 nm thick B and Na enriched layer, after initial forming, (Figure 2) becomes a 50-100 nm depleted layer after exposure to an acidic solution for 18 days (Figure 3a). Not surprisingly, increasing time of exposure leads to a thicker depletion layer (Figure 3b). ICP-MS (not shown) confirmed elevated levels of Na and B in the stored solution, compared to levels in the solution at the start.
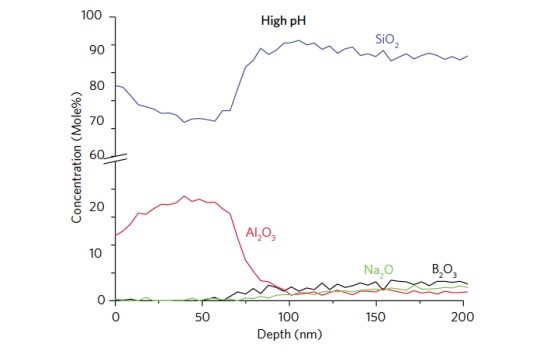
At high pH, the mechanism of corrosion in silicate glasses is fundamentally different than at low pH. Rather than removal of modifying species, the Si-O-Si structure of the glass dissolves. The surface of a vial exposed to high pH contains a 75 nm Al2O3–rich layer. The Al2O3 concentration (>10 mole%) was found to be significantly higher than in the bulk (Figure 4).
In conclusion, there are a number of processes in both the forming and use of Type I glass vials that can result in significant chemical gradients. These gradients may lead to mechanical or other stresses that ultimately result in the production of microscopic flakes under certain circumstances. A suite of analytical tools can be used to track changes in the surface chemistry, solution chemistry and defects. These include: SIMS, XPS, SEM, optical microscopy and ICP-MS, which can all provide valuable information regarding the effect of a stored solution on the glass storage medium.
Figure 3 Exposure to low pH solution for 18 days and 64 days leads to the creation of layer depleted in B and Na and the formation of a silica-like surface layer.
Figure 4 Depth profile of a vial exposed to a high pH solution
References 1 RG Iacocca, Pharma Tech (2011) s6-9 2 USP “Evaluation of the Inner Surface Durability of Glass Containers
Would you like to learn more about Glass Delamination in Pharmaceutical Vials?
Contact us today for your glass delamination in pharmaceutical vial needs. Please complete the form below to have an EAG expert contact you.
To enable certain features and improve your experience with us, this site stores cookies on your computer.
Please click Continue to provide your authorization and permanently remove this message.