Home » Fluid Imaging AFM of Cellulose Bio-membranes
Cellulose is a naturally occurring, linear polysaccharide used in a wide range of industrial and consumer product applications including as a chief ingredient in paper and textile manufacturing, as a biofuel, and as a thickening agent and stabilizer in food products. The semi-permeability of the polymer lends itself to function well as a filter; therefore, modified cellulose materials often are utilized in the biomedical industry in dialysis tubing to treat kidney disease.
Dialysis tubing membranes are differentiated by their molecular weight cutoffs (MWCOs). MWCO is a parameter related to the number of pores and the average pore size, which can be controlled by the cellulose chain length and by the degree of cross-linking. The MWCO of a material will dictate what size of molecules will or will not pass through and thus determines the effectiveness of the membrane in removing waste products from a patient’s bloodstream. Characterizing pore size and topography will be essential to design bio-membranes with ideal filtering properties. Another application of modified cellulose in which topography is critical is drug delivery where pore size directly impacts drug encapsulation stability and release kinetics.
Atomic Force Microscopy (AFM) is a commonly used analytical technique for characterizing bio-membrane topography because it can be performed in fluid. Analyzing hydrated bio-membranes in-situ is ideal to avoid any possible shrinkage and non-representative alterations to topography upon drying or exposure to vacuum. During an AFM measurement, a probe tip several nanometers in diameter and suspended at the end of a cantilever is raster scanned across a surface. The tip movement is monitored by a laser reflected off the back of the cantilever and a feedback loop maintains either a constant cantilever deflection (contact mode) or constant vibration amplitude if the tip is oscillated near its resonant frequency (tapping mode). The electrical signal in the feedback loop needed to maintain constant deflection or amplitude is converted into height information to provide a 3D rendering of the surface under investigation. In this application note, fluid imaging AFM is performed to characterize the pore size of 1000kDa dialysis tubing.
EXPERIMENTAL
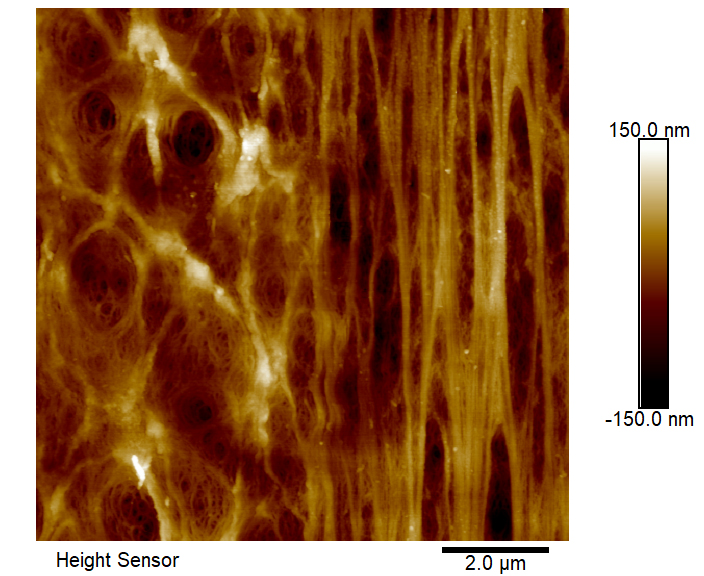
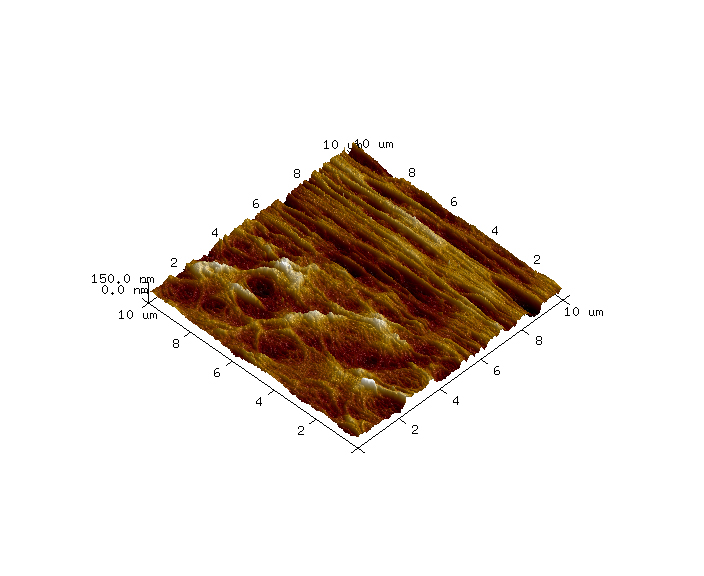
Figure 1. 1000kDa dialysis tubing (10μm x 10μm x 300nm)
AFM images were collected in tapping mode using a Dimension Icon AFM instrument (Bruker, Santa Barbara, California, USA) and a PNP-TR C2 probe (NanoWorld; Neuchâtel, Switzerland). The sample was mounted in a fluid cell and analyzed under deionized water. One 10μm x 10μm survey image was collected to identify a suitable sub-region which had high pore density. Then a 1μm x 1μm image was collected using higher resolution conditions. The topography differences of these images are presented in colors where the brown is low and the white is high. The z ranges are noted on the vertical scale bar on the right side of the images. Perspective (3-D) views of these surfaces are also included with vertical exaggerations noted in the captions.
RESULTS AND DISCUSSION
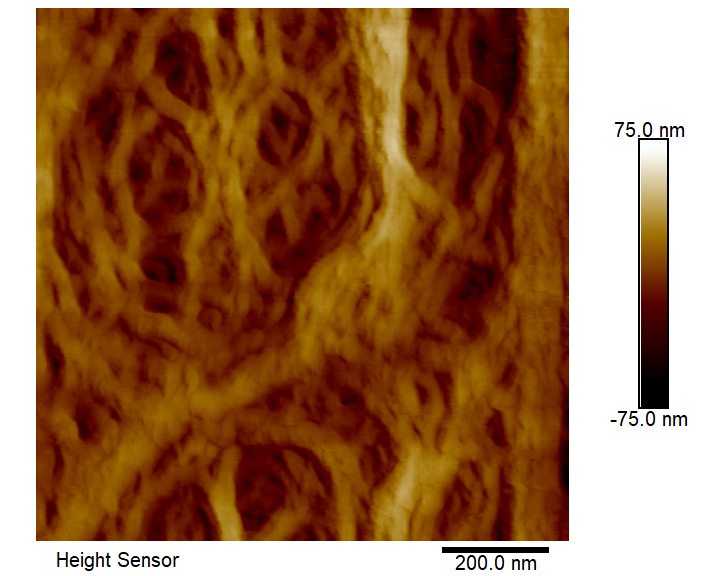
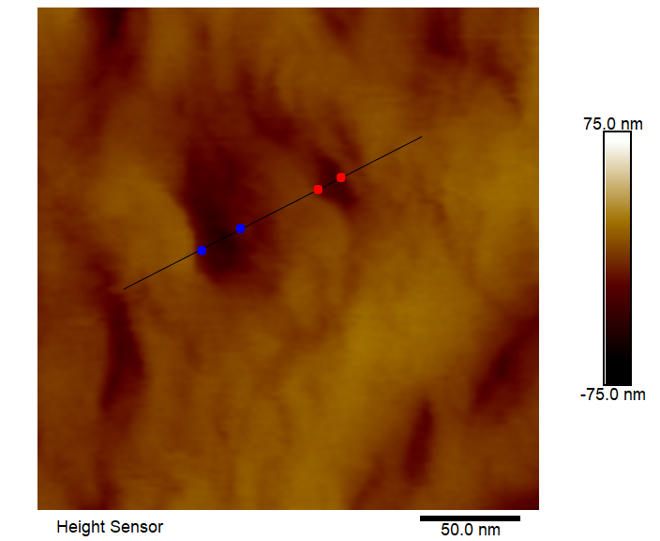
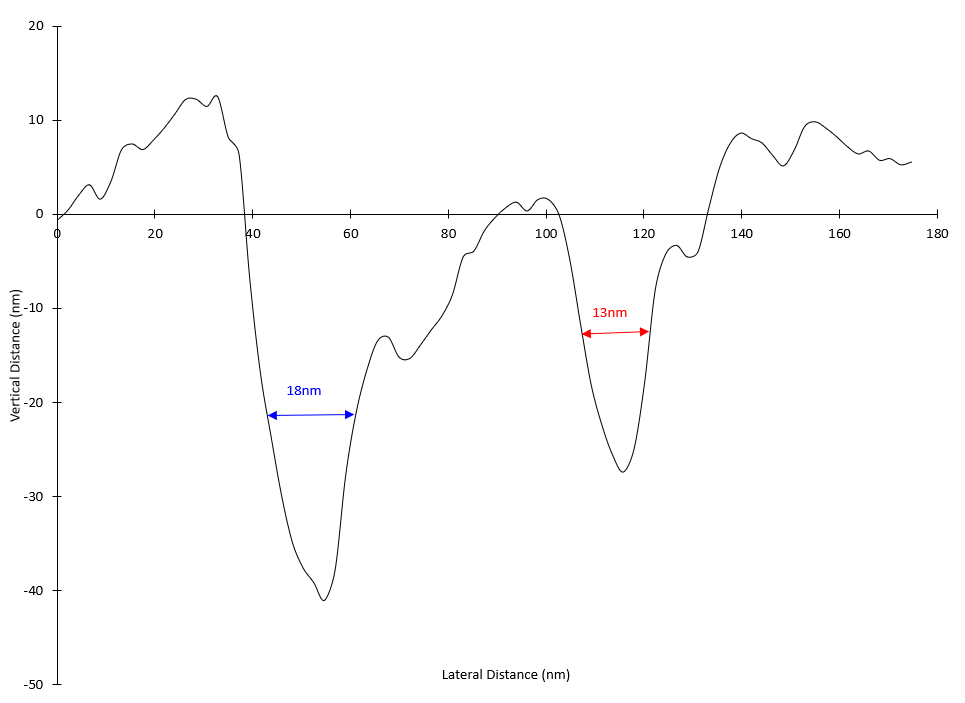
On the dialysis tubing sample, a variety of large-scale topographic features were observed in the 10μm x 10μm survey AFM image, such as closely packed, vertically aligned strands and broad, webbed regions with accessible pores (Figure 1). A sub-region with a high density of pores was selected for high resolution imaging (Figure 2) and several pore diameters were measured using section analysis. Section analysis is a post-processing method that entails selecting a line distance and position across the AFM image. The output is a line profile graph of height versus X/Y distance that can be evaluated for feature height (or depth) and lateral dimensions. The red and blue cursors in the section profiles and 2D images indicate the measurement locations. The ‘Horizontal Distance’ column in the bottom box reports the pore diameters (i.e. ~ full width at half maximum). The pore diameters that were measured ranged from 13nm to 18nm (Figure 3). AFM images at additional locations and extensive data processing to measure a larger sampling of pores would provide pore diameter statistics that could be correlated with dialysis tubing properties and performance.
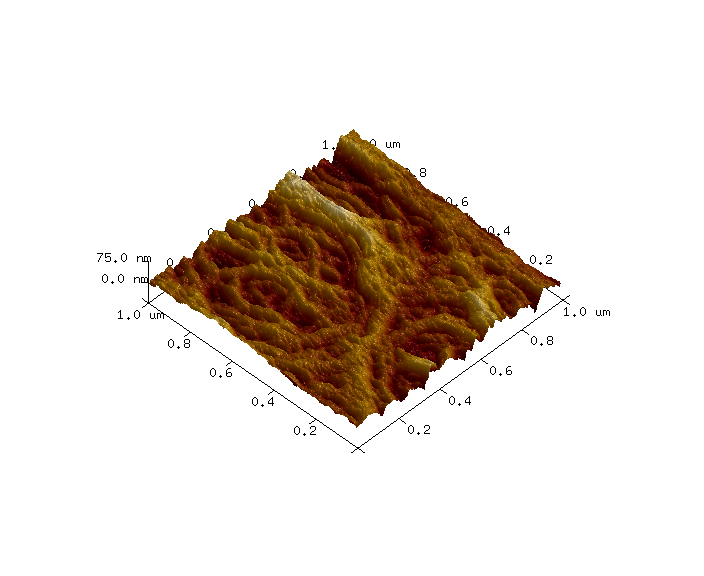
Figure 2. 1000kDa dialysis tubing (1μm x 1μm x 150nm)
Figure 3. 1000kDa dialysis tubing (0.25μm x 0.25μm x 150nm), representative section analysis
Would you like to learn more about Fluid Imaging AFM of Cellulose Bio-membranes?
Contact us today for your fluid imaging AFM of cellulose bio-membrane needs. Please complete the form below to have an EAG expert contact you.
To enable certain features and improve your experience with us, this site stores cookies on your computer.
Please click Continue to provide your authorization and permanently remove this message.