
A Solution for Sensitive Materials – Cryo FIB
Cryo FIB uses a cold sample stage that can be controlled to -135°C making it it more suitable for temperature sensitive materials.
Home » Composition Analysis on 3D Printed Titanium
Driven by technological advancements, the additive manufacturing (AM) market, also known as 3D printing, continues to rapidly grow. Improvements in 3D printers’ accuracy and speed provide an alternative to traditional manufacturing. AM is proving to be a more cost-effective solution for applications where low production volumes, short turnaround times, complex part geometries, and/or high-value materials are used.
In order to achieve the desired mechanical properties with AM, the chemistry, microstructure, and defects should be controlled. Materials analysis throughout the entire value chain is critical in achieving a high-quality product.
X-Ray Diffraction (XRD) is used to detect the crystal structure, grain size, and orientation in a sample. The grain size and orientation affect physical properties like hardness and electrical and thermal conductivities.
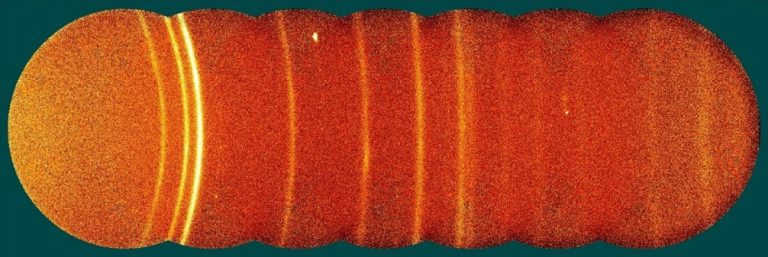
The image below is the 2-D frame data taken from the Bruker D2 instrument equipped with a 2-D Vantec detector. 2-Theta increases from left to right, while the intensity is represented by the brightness of the image shown. Smooth, continuous arcs at a particular 2-Theta
value represent a good distribution of orientations of small crystallites, while bright spots along the arcs or spotty arcs represent orientations of crystallites in specific directions or large crystallites, respectively. From these data, it can be seen that many of the arcs are comprised of small crystallites with a relatively well-represented breadth of crystallite orientations, while some very bright spots exist in what must be a separate phase that contains large grains in very few orientations.
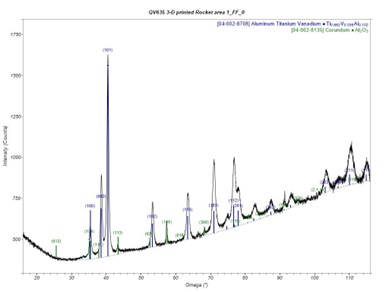
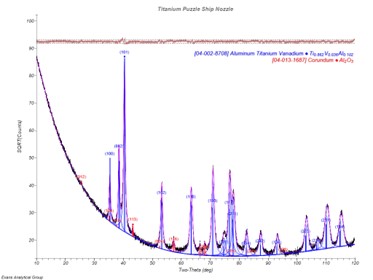
Integrating these data in the gamma direction (along the arcs) sums the intensity along the 2-Theta axis and provides a normal diffraction pattern as seen in the image to the right.
These integrated data highlight more information not immediately apparent in the 2-D frame data. In particular, the rising background in these data indicate fluorescence, which, when using copper radiation as a source, is usually due to either vanadium, chromium, manganese, or iron.
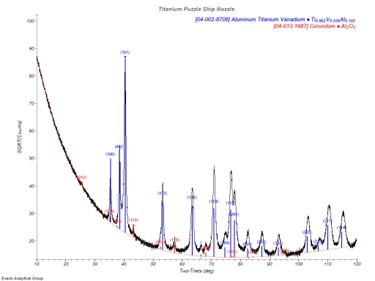
The 1-D detector of the Rigaku smartlab instrument, “novalab”, does not show the same rising background because of the energy discriminator on its Dtex 1-D detector, and, instead, displays a higher background through the collected data, which is only observable when looking at the normal background curve of the instrument from a non-fluorescent material.
With these two data, the main phase was identified as a titanium vanadium aluminum alloy (TiVAl). The secondary phase present could be identified as either titanium aluminum oxide or aluminum oxide (corundum), though it is more likely to be corundum.
Peak fitting shows the crystallite sizes for the main phase average to about 18nm. The corundum phase shows relatively consistent crystallite sizes throughout the pattern, averaging at about 22nm.
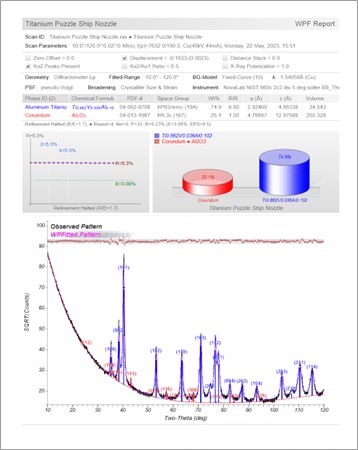
Whole pattern fitting results show a roughly 1:3 ratio of the corundum phase to the TiVAl phase in the measured area. A change in this ratio from the Bruker Vantec data may highlight composition differences in different parts of the sample or different sampling depths.

Whole pattern fitting analysis shows the Bruker Vantec data with similar numbers for the samples composition at roughly the same ratio, lending to the idea that the composition of the ship is consistent through large length scales.
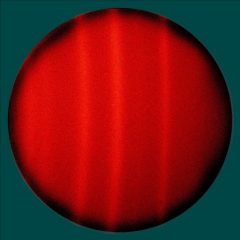
A single 2-D frame from the Bruker Vantec instrument centered at 110 degrees 2-Theta and taken at no tilt (0 Psi) is the first step in calculating the residual stress in the sample. Increasing the Psi value (tilting the sample) and measuring the peak shift allows for a plot of the “Sin^2(Psi)” the sample at higher 2-Theta angles allows for the calculation of residual stress in the sample. In particular, the TiVAl (2 1 1) reflection was used to calculate the residual stress.
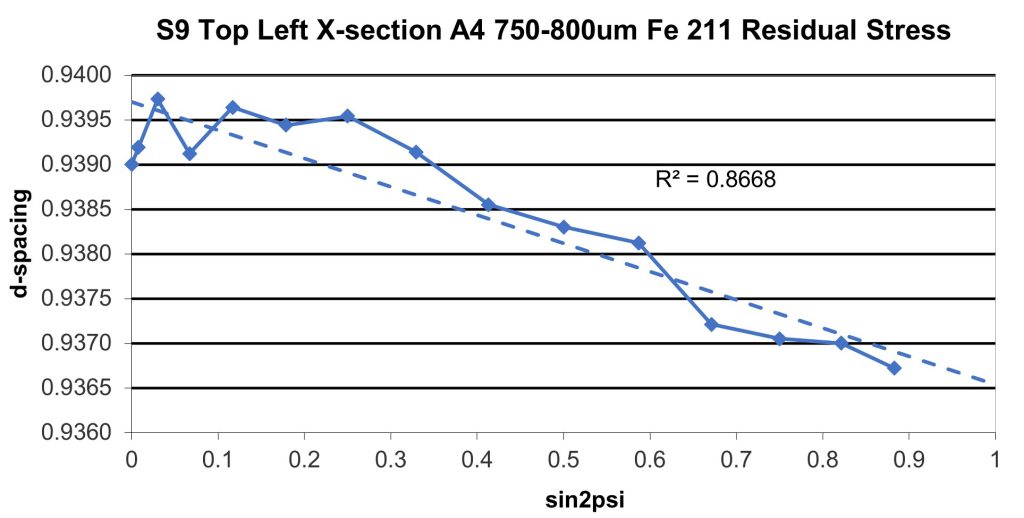
With Psi values every 5 degrees from 0 to 70, a Sin^2(Psi) vs. d-spacing plot provides a slope that represents a function of the stress, the Poisson ratio, and elastic modulus of the material. These data represent a residual stress of -37 Ksi (kilopounds per square inch, representing compressive stress in the sample.
Much like with any other type of sample, XRD analysis provides identification of crystalline phases present. For 3D printed materials that come from a matrix of multiple elements, it can be unclear whether the cooling creates one, consistent phase of material or if it separates out into multiple phases. It is also unclear whether a reaction with oxygen occurs at high temperatures that changes the possible phases, oxidation states, and oxygen content in the final product. In this case, the sample was seen to contain two phases, one of which had oxygen present. It is unclear whether the matrix of printing material had that present or if this was simply an impurity that occurred, but that information is important to have. Crystallite sizes can also be measured, which is another important parameter for 3D printed materials, and can change based on the matrix, heating temperature, cooling rate, and other factors. Residual stress, percent crystallinity (less important for 3D printed metals, but important for non-metals), and semi-quantitative analysis can all be provided for similar reasons – ensuring the part is fabricated to correct specifications to serve its purpose.
At Eurofins EAG, our technical experts have many years of experience working with our clients to help solve composition related questions or problems. Contact us today to learn how we can help you on your next 3D printed project.

Cryo FIB uses a cold sample stage that can be controlled to -135°C making it it more suitable for temperature sensitive materials.

EAG scientists are leaders in the lithium-ion batteries recycling arena. EAG is a valuable resource in understanding these materials.

Li-Ion electrodes are more than just energy suppliers; they’re intricate mazes of structures and materials. Their design and intricate layout play pivotal roles in determining a battery’s capacity, discharge rate, and overall lifespan.
Highly complex chemistry materials such as geological materials, minerals and ceramics, a specialized sample preparation is used. For these types of materials, fusion sample preparation is used to increase precision and accuracy for data collection.
To enable certain features and improve your experience with us, this site stores cookies on your computer. Please click Continue to provide your authorization and permanently remove this message.
To find out more, please see our privacy policy.