Chemical Imaging of Pharmaceuticals
Home » Chemical Imaging of Pharmaceuticals
Oral pharmaceutical tablets and capsules frequently contain multiple organic and inorganic excipients in addition to the active pharmaceutical ingredient (API). These ingredients each have a specific function and desired location for optimum performance. For instance, a rapid release product may contain a disintegrant that promotes the release of the API in the stomach.
An extended release product may house the API below more slowly dissolving coatings that allow the gradual release of the drug. Some components may be incompatible with the API or other excipients and therefore are designed to be kept separate in the final formulation.
Understanding such complex formulations requires analytical tools capable of probing the chemistry on the micron- or sub-micron length scale. EAG Laboratories uses Time-of-Flight Secondary Ion Mass Spectrometry (TOF-SIMS), Scanning Electron Microscopy with Energy Dispersive X-ray Spectroscopy (SEM-EDS) and Raman spectrometry for these types of investigations.
TOF-SIMS and Raman spectrometry have the ability to identify different organic (and many inorganic) materials while SEM-EDS is an elemental analysis technique only and, thus needs a unique element associated with each material for identification. Thus SEM-EDS has limited ability to distinguish organic constituents.

DISCUSSION
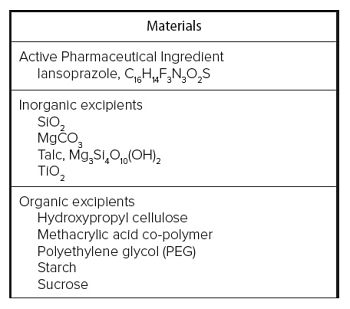
In this study the objective was to image ingredients in an over-the-counter (OTC) heartburn medicine using SEM-EDS and TOF-SIMS. A partial listing of the ingredients is provided in the table 1.
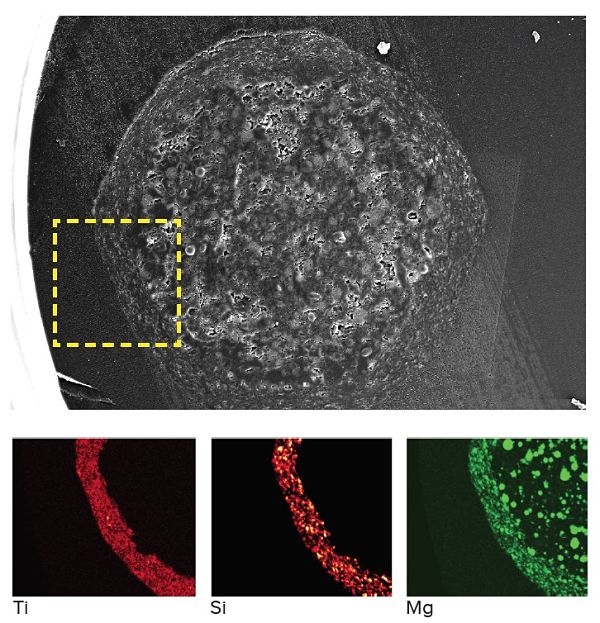
A secondary electron micrograph of a cross sectioned 800µm bead in Figure 1 shows a two-layer structure. SEM-EDS maps of Ti, Si and Mg from the lower left quadrant of the bead are included. The titanium map indicates the presence of TiO2 in the outer layer, likely used as a pigment. Silicon is present in both SiO2 and talc, is also confined to the outer layer, while Mg is present as a finely dispersed material in the outer layer, but as 5-10µm spheres in the core. Based on the Si and Mg maps, talc appears to be present in the shell while MgCO3 is present in the core.


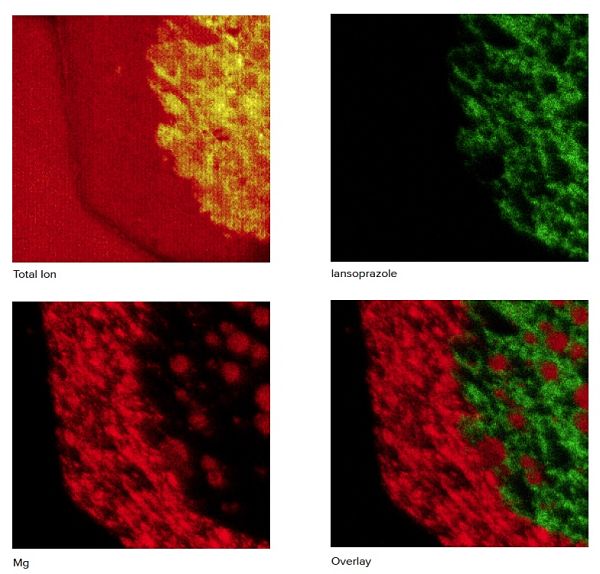
The organic components are identified by way of unique molecular ion fragments created in a TOF-SIMS experiment. The image at the upper left shows the position and relative intensity of all emitted ions. Similar to the EDS map, the TOF image for magnesium (lower left) shows it present in the shell (talc) and core (MgCO3). The real power of TOF-SIMS imaging is shown in the upper right image which is the 2-dimensional image of lansoprazole molecules within the drug. An overlay of Mg and lansoprazole shows the complimentary distribution of each material. A similar map (not shown) for hydroxypropyl cellulose (HPC) confirms that it is located in the core of the pellet.
The drug contains an enteric coating that prevents the release and subsequent degradation of the API in the highly acidic stomach environment in favor of the more neutral small intestine. The HPC, found within the core, likely protects the API in stomach.
In summary, 2-dimensional chemical imaging of finished drug products can be invaluable for understanding the location and distribution of organic and inorganic constituents. This information is important for formulation scientists. It can also be critical in intellectual property cases where patent law frequently dictates the location and function of materials.
Would you like to learn more about Chemical Imaging of Pharmaceuticals?
Contact us today for your chemical imaging of pharmaceutical needs. Please complete the form below to have an EAG expert contact you.